|
Climate-Stat Inc.
Applications
|
Climate forecasting at the forefront of the GIS revolution
G-MagTeledyn is the next generation of climate modeling. Pending successful demonstration R&D, the inputs provided will greatly assist current models by correctly accounting for geomagnetic influences.
To deliver consistently accurate predictions over longer periods of time, it is necessary to apply a more comprehensive and integrated data source.
The Tele-Dynamic relationship between barometric pressure change and the force of gravity is approximately 0.30 ugal/mbar (Warburton and Goodkind 1977). Superconducting gravity meters indicate strong correlations between the gravity residual (results obtained by removing the effects of tides) and barometric pressure changes at frequencies associated with weather patterns. Six ugal changes in the gravitational field are typical with barometric fluctuations in sea-level pressure. Maximum fluxes of up to about 45 ugals can occur. The gravity variation which results from a given pressure variation depends on this coherence distance” (Warburton and Goodkind 1977).
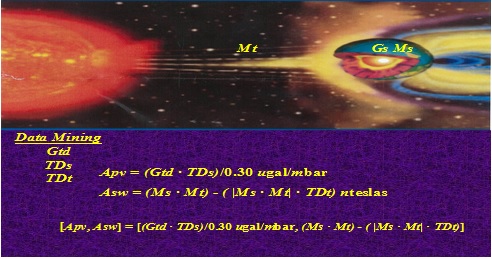
Computational Components for Creation of Grid Atmosphere Outputs
Yellow circles indicate hurricane track intersections suspected of attraction to
underlying geomagnetic anomalies.
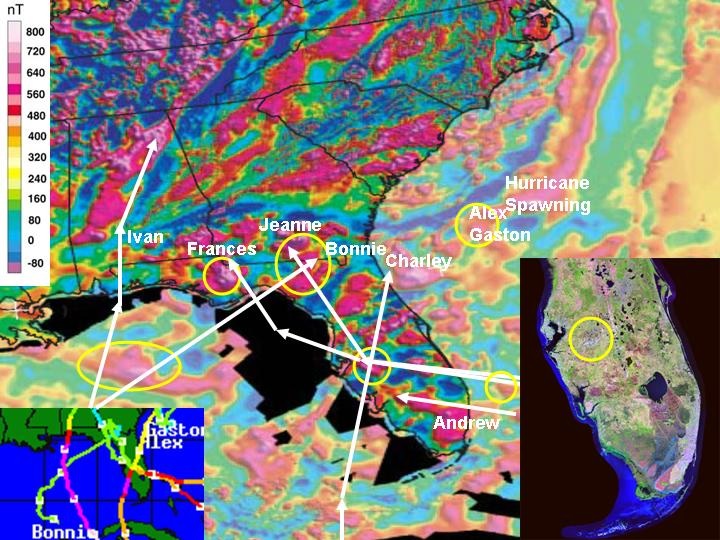
Geomagnetic trends of the Southeast United States passive margin (USGS).
Yellow
circles represent suspect anomalies with telluric activation.
Uses Gravity Recovery and Climate Experiment (GRACE) data to dynamically track monthly gravity field changes, to monitor local trends of geoidetic change at spatial and temporal resolutions compatible with proposed commercial application developments for geophysical inputs affecting potential surface vorticity globally. The functional relationships exploited are the thermal and gravitational forcing of atmospheric pressure linked to geophysical origins currently unaccounted for in atmospheric models. This unaccounted for variability is linked to activation of telluric currents induced by short term solar variability and longer term variability of planetary magnetism and solar system tidal affects. A way of accounting for this variability with historical time series observations and then projecting it for improved forecasting is the objective.
| GGM02 Geoid model derived from GRACE. |
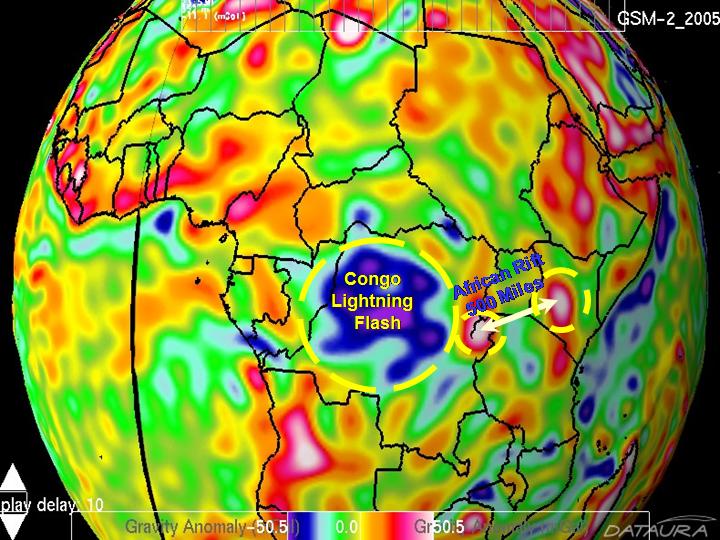 |
| Note Congo Signature: Imagery from Gravity Geiod ExplorerTM Geostreams - Dataura. |
Congo GGM02 Geoid model derived from GRACE gravity mission data. GGM02 is latest composite representing the average
gravity field over the mission life.
| High Resolution Full Climatology Annual Flash Rate |
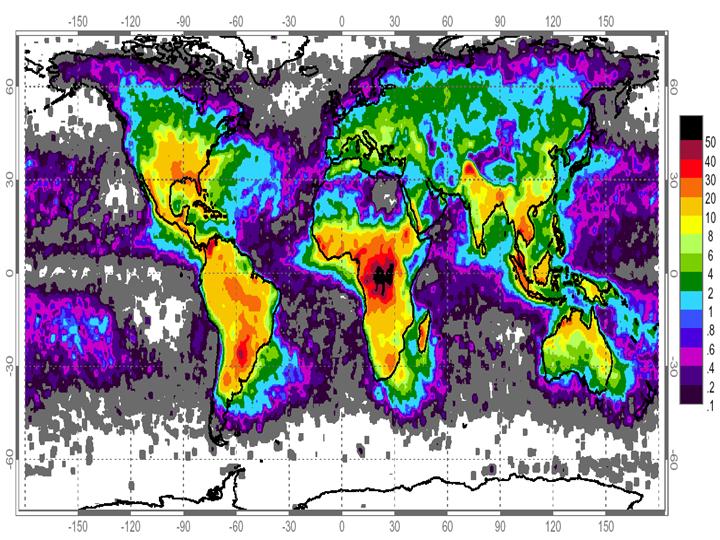 |
| April 1995 - February 2003 from the combined observations of the NASA OTD and LIS |
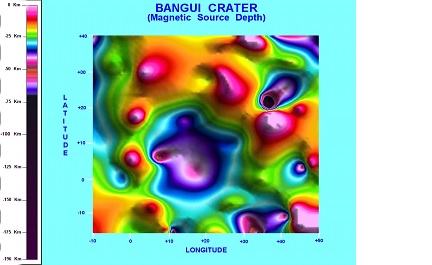
Congo Magnetic Anomaly Underlies the Gravity and Lightning Anomalies and is likely a Tectonic Vortex, but Conventionaly Interpreted as a Meteor Impact, both interpretations could be correct. Congo Bangui Magnetic Anomaly from 61 - 90 spherical harmonics of the mf3 geomagnetic model produced by Stefan Maus NOAA/NGD and Cires in Boulder, CO.
The ClimateScope exploration software is broad user based assimilating multiple heterogeneous environmental data into a unified temporal and geospatial setting. The engine of ClimateScope builds around a unique user-interface enabling the user to navigate, select, and interact with global remote sensed data. The interaction is done within the visualization itself.. a virtual reality.. as if, reaching through a window, controlling the scene. The scene interface approach removes distraction and complexity involved with conventional user- interface layers. Display and analysis of data is controlled by user selections with the mouse. The user-interface concept in ClimateScope my be applied in many other visualization/exploration geo-spatial markets like oil and gas, meteorology, geo-political news media services and science education.
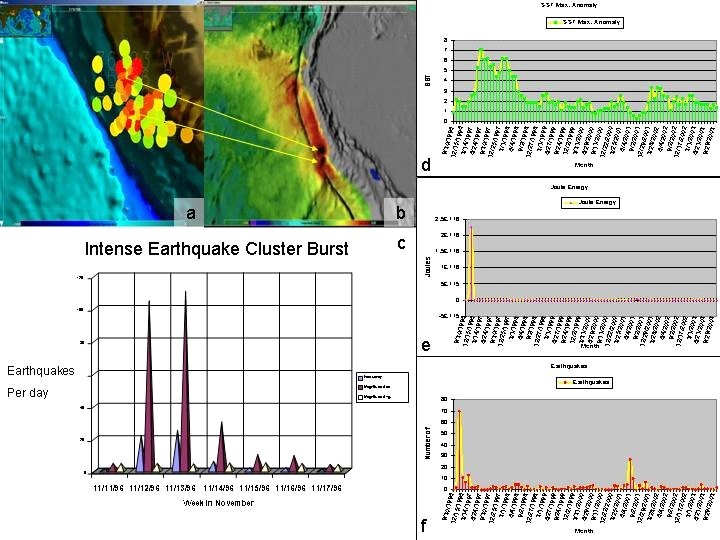
Fig. 1(a). Two distinct clusters of earthquakes off the Coast of South America
in Nov. 96 are apparent.(b). SST’s seem to emanate in a similar pattern to the earthquake paired clusters. The northern
SST anomaly is on the continental shelf as is the northern earthquake cluster, while the southern SST anomaly is further offshore
over the continental slope as is the southern earthquake cluster. These SST anomalies appeared (June 1997)
just north of earthquake positions possibly due to prevailing long shore currents, about 7 months after the paired earthquake
clusters. (c). Chart indicates earthquakes/day (Frequency), magnitudes are added for simple power indicator (Magnitude Add), along with an average (Magnitude Avg.) A spike in earthquake activity begins Nov. 12th and tapers off Nov. 14th revealing the intense episodic nature of these events.
(d). SST Max. Anomaly/month indicating anomalies > 7° C by June 97 followed by a year of elevated SST anomalies associated with the 97/98 El Nino.
(e). Joule energy released during
(f). Earthquake events Nov. 96.
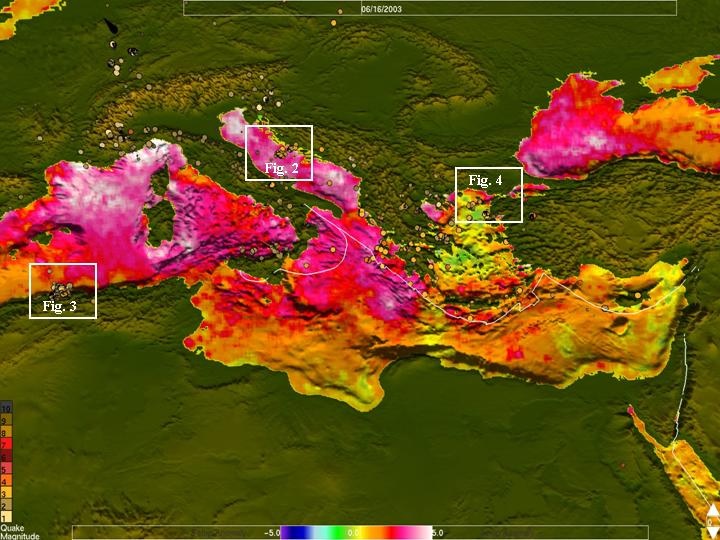
Fig. 1a.
Mediterranean SST Anomaly Map Indicating 2003 Summer Heat Wave.
Adriatic Inset -Fig. 2.
North African Inset -Fig. 3.
Turkish Straits Inset –Fig. 4
Indicated in data mining examples below.
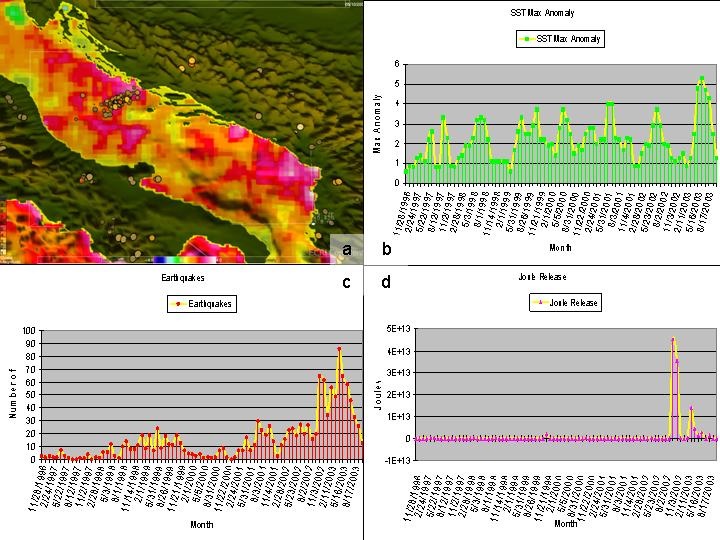
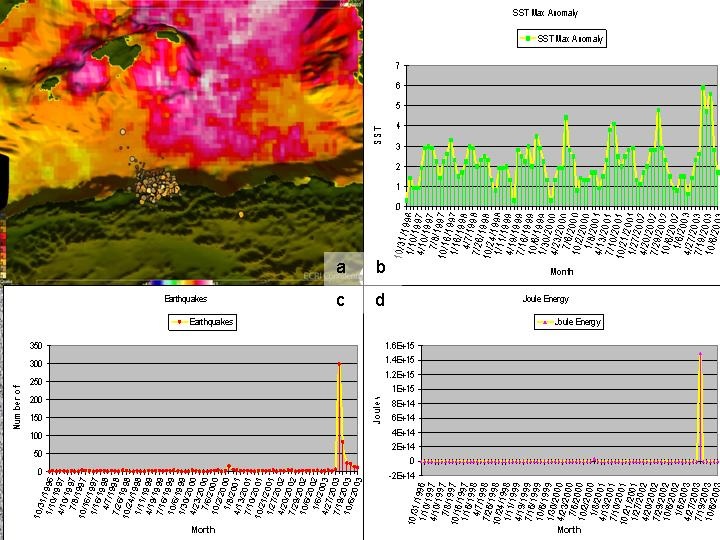
Fig. 3(a). North African (Algerian) earthquakes and SST’s during June 2003.(b). SST Max. Anomaly/month indicating anomalies > 5° C lasting months in 2003(c). Following earthquake events in May 2003.(d). Coincident joule energy release.Note: Max SST Anomaly trend in white strikes northeast directly away from earthquake cluster.
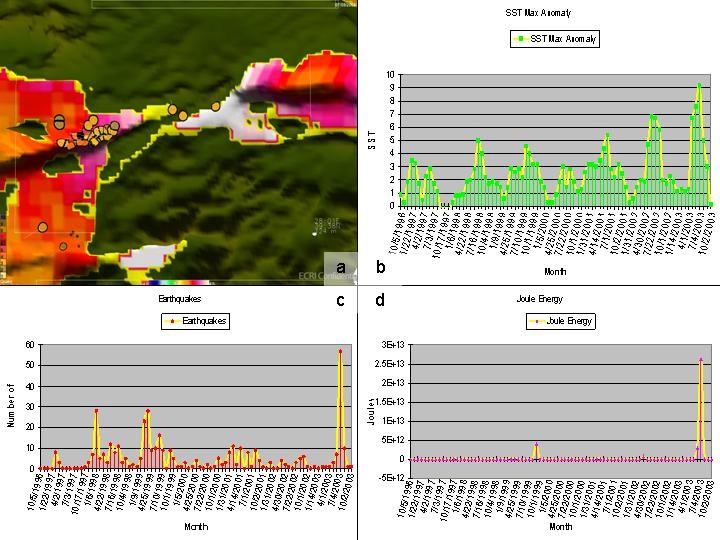
Fig. 4(a). Earthquakes to the west and simultaneous SST anomalies east and south of Turkish Straits along the North Anatolian Fault system.
(b). SST Max. Anomaly
         and month indicating an anomaly > 9° C in July 2003 occurring simultaneously.
(c). Earthquake events in July 2003.(d). Coincident joule energy release.
