|
Climate-Stat Inc.
Hurricane Tracking
|
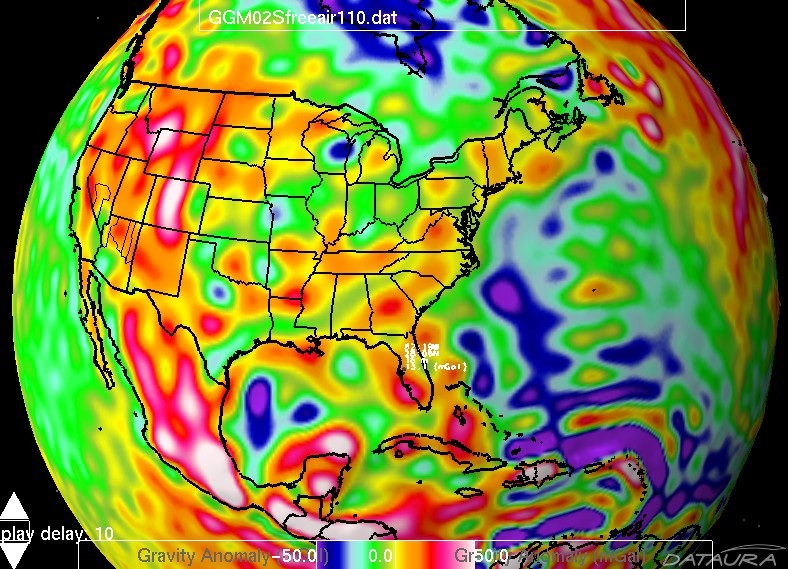
GGM02 updated from GGM01 using spherical harmonics up to order 200, no other constraints from altimetry or surface gravity measurements. This is a static model with no time series represented. Imagery from Gravity Geiod Explorer – Geostreams/Dataura.
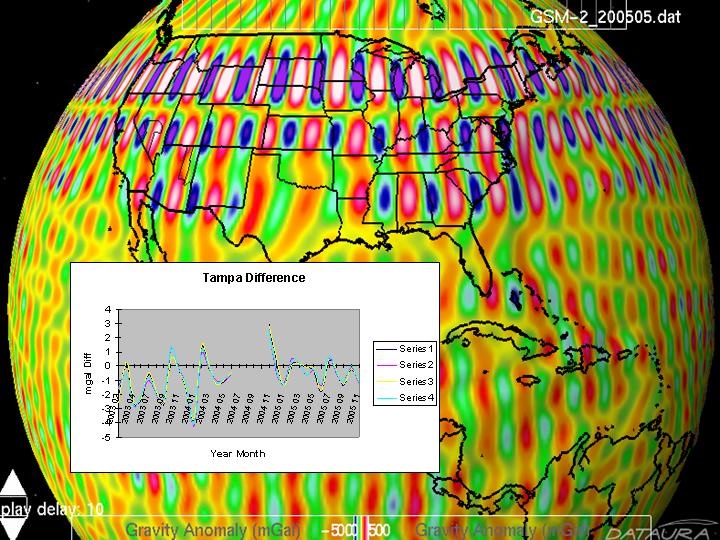
Data mining GRACE at four 15’ grid samples in Tampa Bay Region from Feb. 2002 to Nov. 2005 is an average differenced residual in which the residual monthly free air time step is differenced from the average GGM02 data to produce the anomalous banded pattern. The average increase of the gravity field is more apparent with this plot and looks near +1 mgal from an eyeball appraisal. In the time series animations interesting wave forms appear to move around the planet from west to east, reflected in the troughs and peaks of the plotted data. Imagery from Gravity Geiod Explorer – Geostreams/Dataura.
| Composite of seasonal lightning over Northern Gulf |
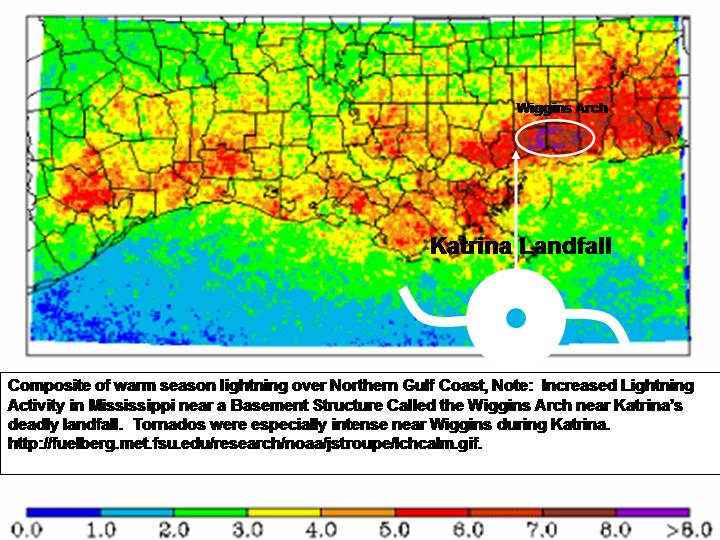 |
| Lightning Activity in Mississippi near a Basement Structure Called the Wiggins Arch. |
Composite of warm season lightning over Northern Gulf Coast, Note: Increased Lightning Activity in Mississippi near a Basement Structure Called the Wiggins Arch near Katrina’s deadly landfall. Tornados were especially intense near Wiggins during Katrina. Small clues are telling.
Sourced from: http://fuelberg.met.fsu.edu/research/noaa/jstroupe/lchcalm.gif.
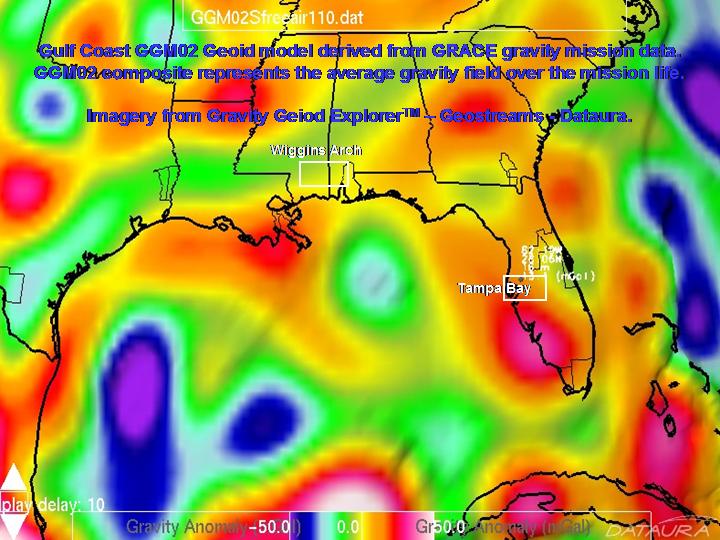
| Gulf of Mexico Geoid model GRACE GGM02 Image |
 |
| Vaisala lightning strike data analysed within a regional geoid improves forecasting . |
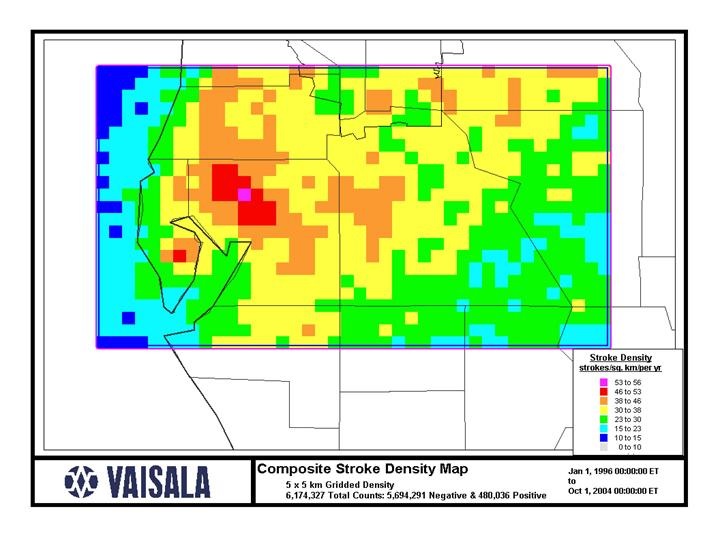
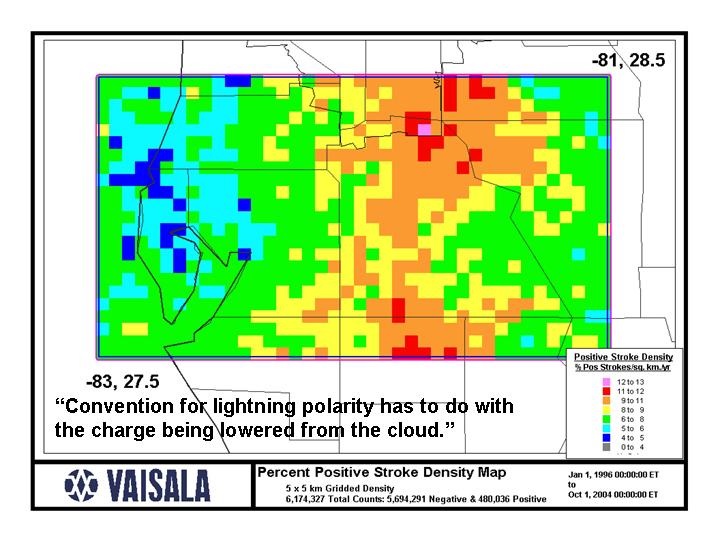
Composite Lightning Strikes from Jan. 1996 to Oct 2004. The majority of strikes North-northeast of Tampa Bay Geospatially Correlate to the Eye Passage of Hurricanes Frances and Jeanne.
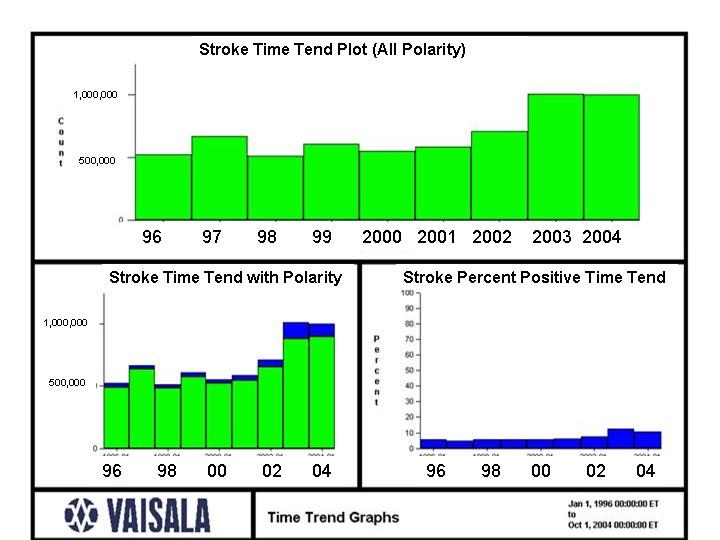
Yearly lightning strike histogram from Vaisala, indicating a near doubling of strikes in 2003 and 2004 from earlier yearly means. Blue indicates strikes with positive polarity.
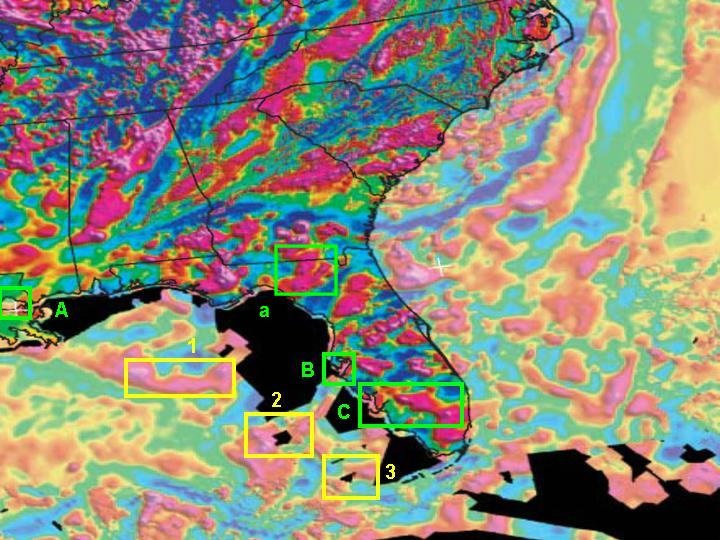
Magnetic trends of the Southeast United States passive margin. Yellow boxes are offshore study locations associated with aquifer outflow in deep water canyons exhibiting SST anomalies over magnetic trends investigated with Climate Scope. Green boxes are onshore study areas associated with high lightning strike regions and magnetic anomalies.
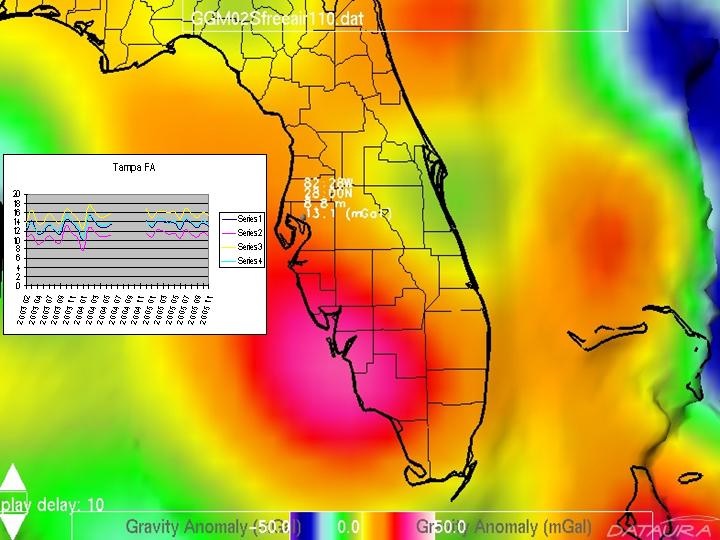
Data mining GRACE gravity free air data at four 15’ grid samples in Tampa Bay Region from Feb. 2002 to Nov. 2005. Data gap is from NASA source data. An average increase in measured gravity is noted in the 2004 season before hurricane season and the elevated average continues through the 2005 season. This is believed to be extra-tidal increasing the conductivity fields by higher densities reflected in the gravity data and may represent an enhanced geo-magnetic activation period. In the time series animations the features appear to vibrate as vales fluctuate. Imagery from Gravity Geiod Explorer – Geostreams/Datura.
